Design Case Study: Enabling F&B SMEs to Make Better Decision with Data
A. Let's Start with The Why?
Food and Drink business is the second largest economy driver for SMEs after retail business in Indonesia, which encapsulates over 16.93% (~4 million people) from other SMEs economy such as construction, insurance, real estate and more. Thus, in the simplest form of explanation, for every 5 people, 2 of them are selling food and drinks
Moreover, in the advent of today's digital economy, we are also witnessing the rise of content distribution platforms such as Tiktok and Reels, the place where trends from memes, fashion and food are emerging. Thus, this new driving force to the economy encourages new sets of challenge and competition for F&B business owners to adapt and stay ahead in order to remain competitive amidst the high-paced market dynamics. However, the real question here is that why this story matters?. Why adapting in today's digital landscape, matters for F&B business owners anyway?
The story matters due to increased competition by the emergence of new business with new sets of strategies that disrupts the market by storm. Therefore, to stay ahead and adapt to these changing horizon, what is the primary challenge that faced by business owners which is addressed in this case study? Product Innovation and Marketing
By definition, Product Innovation and Marketing refers to the business ability to analyze market trends, and apply that knowledge through digital channels and technologies to promote and sell the products effectively. Thus, by that definition, what are some of the pain points that business owners are facing in real world?. Well, here are some pain points and correlation to their needs based on our survey research with ~100 F&B SMEs:
1. Lack of awareness about the importance of data to improve decision making process for product improvement and innovation → Need to be educated and informed about the importance of data analytics to improve their decision-making process
2. Difficulties in collecting and analyzing data due to limited knowledge, accessibility and resources which led to the difficulties in keeping up with the latest trends and make informed decisions about their product innovation and improvement strategies → Need a platform that provides easy-to-use data collection tools that can be used by business owners with limited technical knowledge and resources as well as affordable, to support all business size (SMEs). This can help level the playing field for small businesses that might not have the resources to invest in expensive data analytics tools.
3. Lack of user-friendly data analysis and visualization platform that can help F&B business owners to collect and analyze data effectively → These platforms should be easy to use and understand, and should provide clear insights into emerging food trends and consumer preferences.
B. Design Process
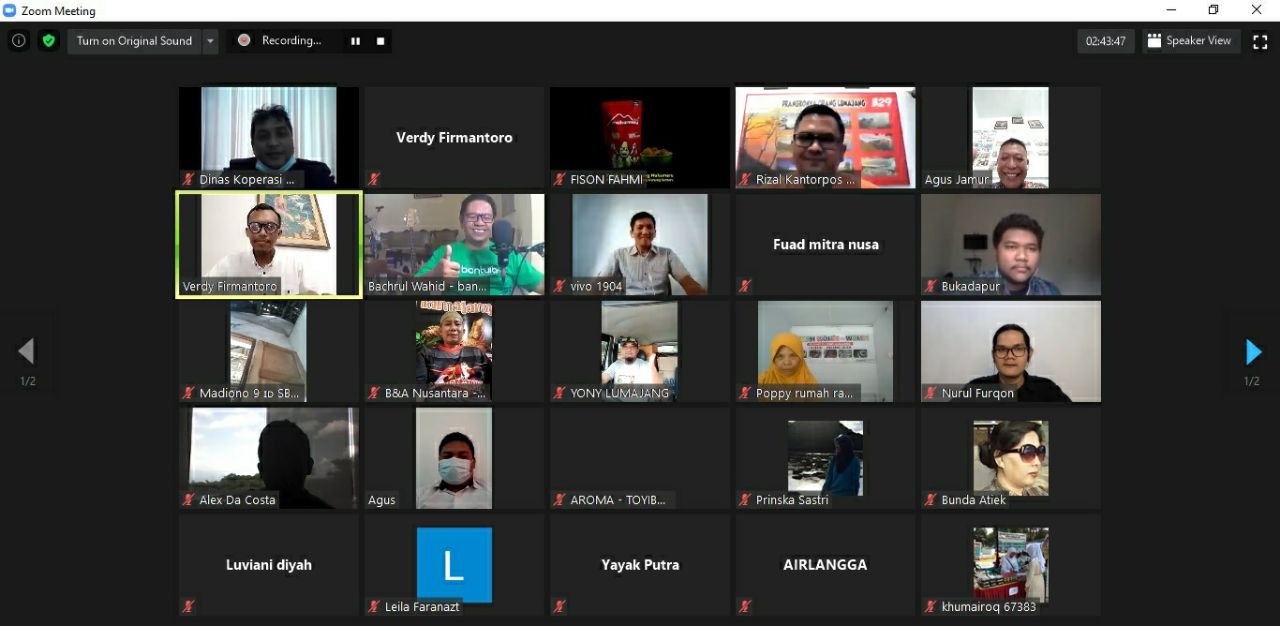 1. Online Workshops with SMEs and Local Government
Relevant to the users need to be educated and informed about the importance of data analytics to improve their decision-making process, we organized a series of online workshops in collaboration with the local government to educate F&B SMEs about the importance of data and also to gather feedback regarding the most required data for their business prior doing technical assessment. Thus now, what are the findings that is related to user's most required data that we collect from the workshop session?
1. Sales Data: Sales is one of the most important data metrics for F&B business owners, as it provides insights into which menu items or products are performing well, and which are not. By analyzing sales data, F&B business owners can identify opportunities for product improvement and innovation, and adjust their menu or product offerings accordingly.
2. Social Media Engagement: This data provides insights into consumer preferences and trends. Thus, by analyzing social media engagement data, F&B business owners can identify emerging food trends and consumer preferences, and adjust their menu or product offerings accordingly.
3. Total Online Search: This data is helpful for business owners to identify opportunities for product innovation and improvement by understanding the data patterns. Thus, business owners can evaluate which recipes or menu that is prospective and sustainable for long-term operations
4. Cost Analysis: This data provides an overview for business owners regarind opportunities for cost savings by analyzing the cost of ingredients and products. By identifying areas where costs can be reduced, F&B business owners can improve their profitability and make their menu or product offerings more competitive.
Moreover, once we've gathered the most required metrics from the users, it's time to conduct technical assessment to identify which data metrics that is possible to collect as an MVP.
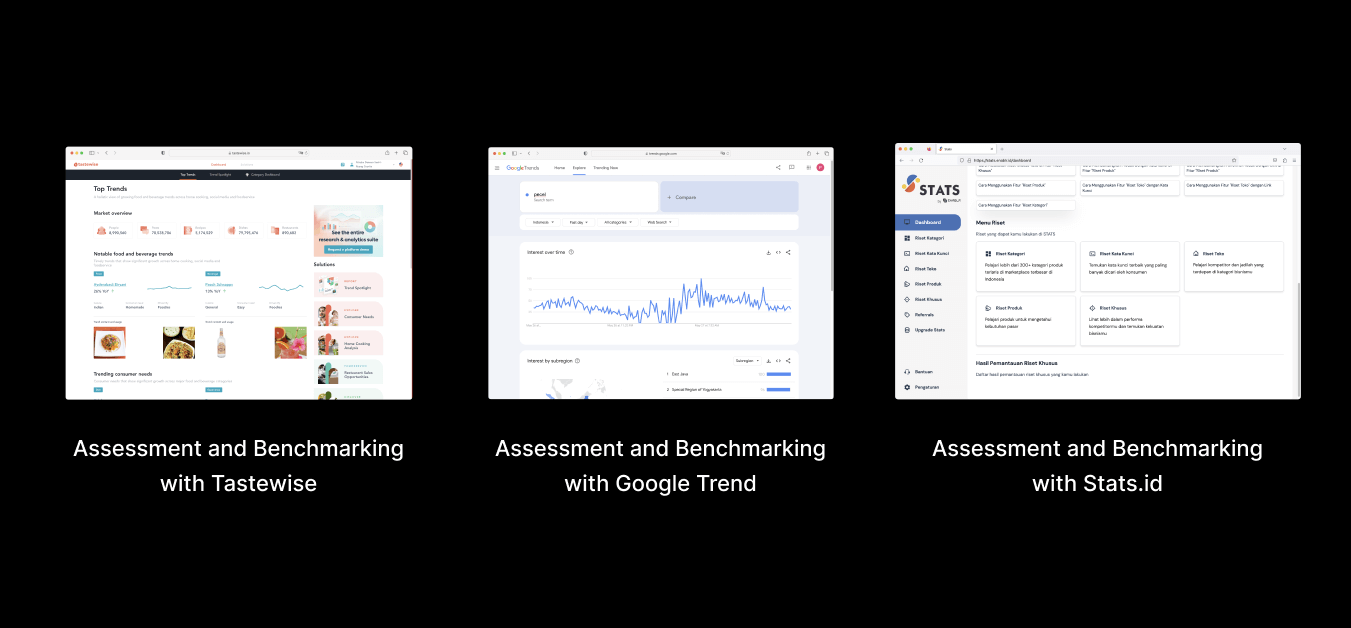 2. Technical and Design Assessment
Relevant to user needs in the second to third points and the most requested data metrics by users, we proceed to conduct technical and design assessment. The goal here is to identify couple of information, such as:
1. Feasibility: The goal is to answer which data metrics that is possible to aggregate?. The reason why we choose to aggregate instead of API integration is to maintain data control that can be store in our own database. By doing this, we can design our own algorithm combined with the aggregated data to do some experiments and innovation with high flexibility
2. Readibility: The goal is to answer how to make sure that users understand what the data represents while at the same time, gain insightful information at a glance?. Based on our benchmark and assessment, some platforms such as Tastewise visualize various of data. But, it takes a bit of time to really understand what the data represents
3. Accessibility: The goal is to answer should we add guest mode instead of force login the users?. Based on our benchmark and assessment, most platforms are forcing users to log in before using the product. Thus, are there other ways where users could still see and explore certain features that led to soft login prompt organically?
4. Scalability: The goal is to answer how to build a system to manage the data asychronously, while maintaining product perfomance on the client side?. Based on our benchmark and assessment, platforms such as Tastwise and Stats took some time to load when processing a large chunk of data request from the users
From this process, we are able to balance what users really need with technical feasibiity to achieve such feat and maintain consumer friendly and intuitive experience
C. Design Preview 🎨
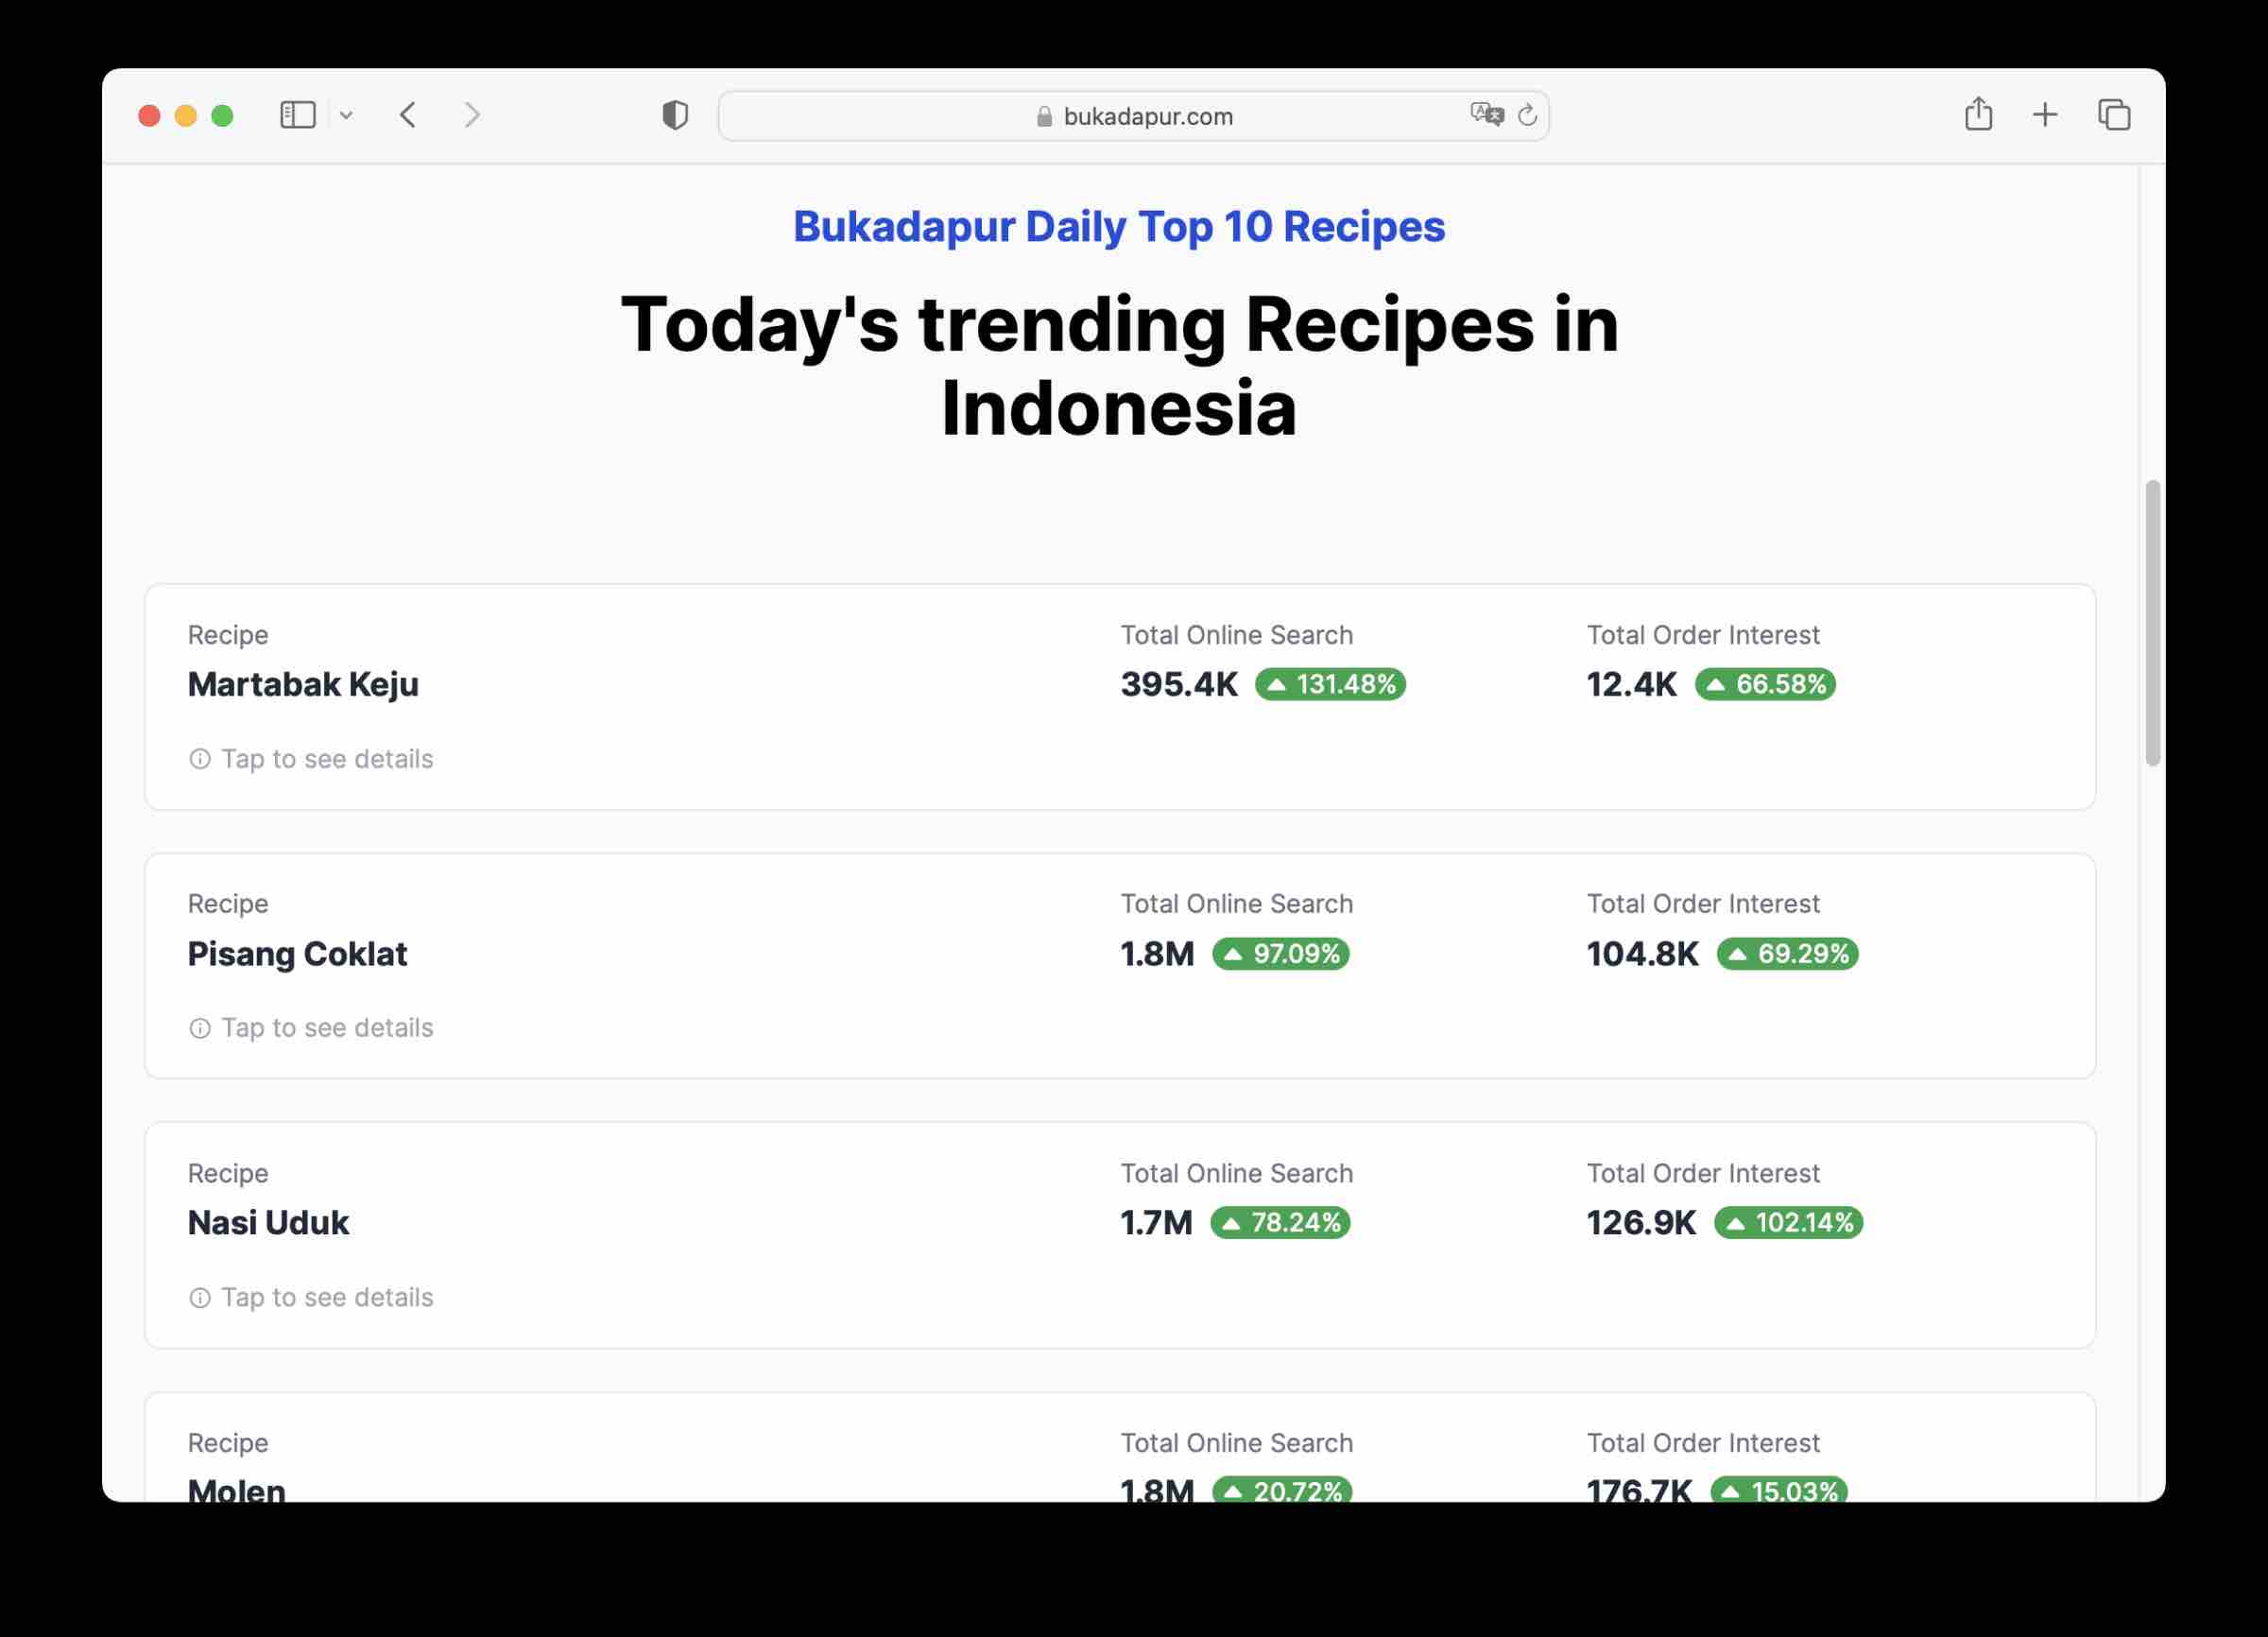
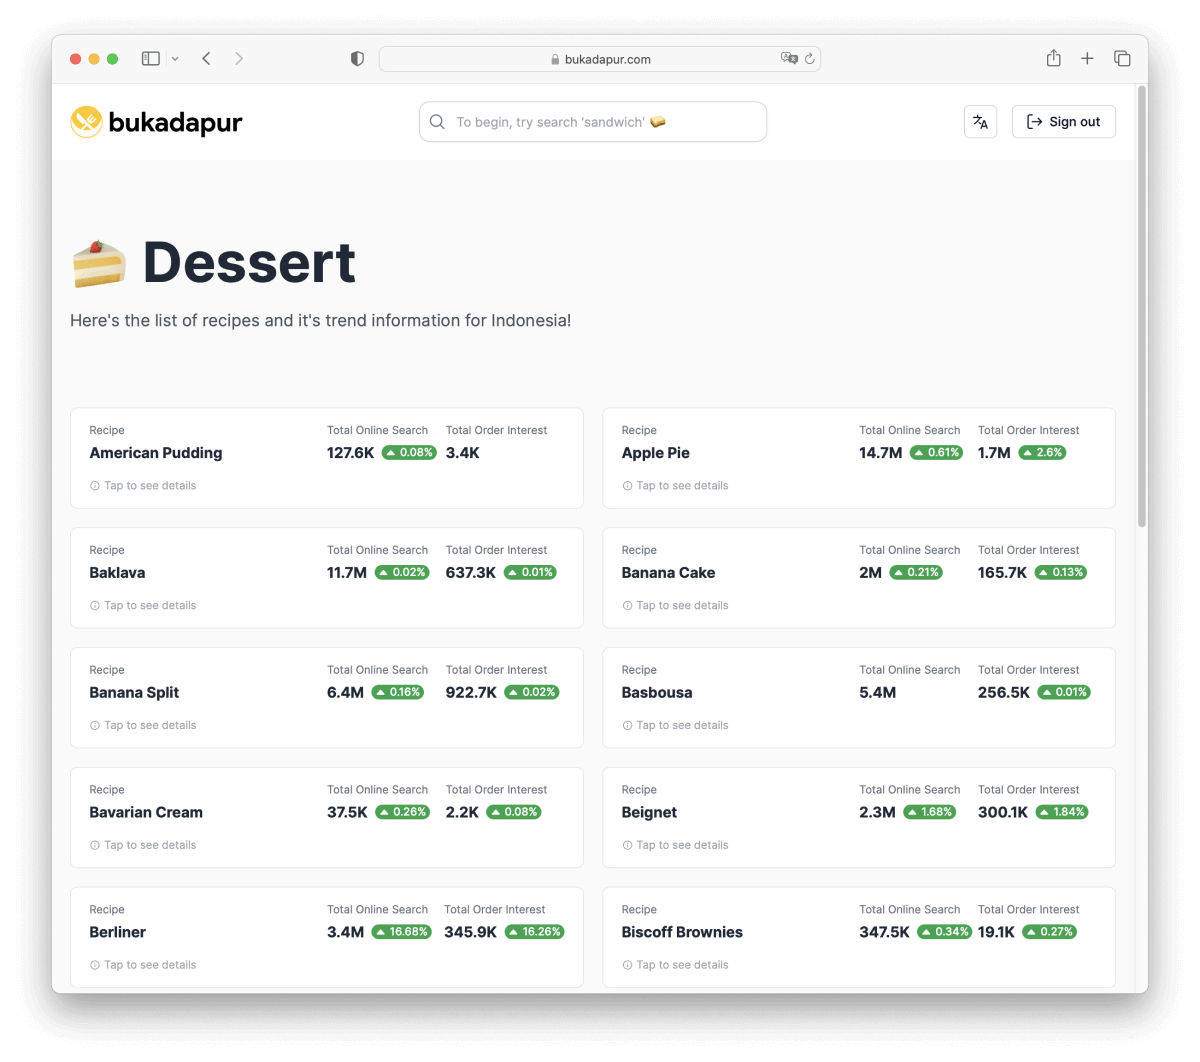
1. Top 10 Daily Recipes in Bukadapur's Homepage
The Top 10 Daily Recipes data provides valuable at a glance insights into emerging recipe trends and based on consumers' preference with two data metrics, Total Online Search and Order Interest (we built our own algorithm based on Likes and Shares data from social media engagement)
The goal of this experience is to help F&B business owners to stay informed about the latest food trends and identify patterns and emerging trends in the types of dishes and ingredients that are popular among consumers. This can help them to adjust their menu offerings to better align with customer preferences, which lead to increased sales and customer loyalty.
Oh, and also, let's not forget that by leveraging the daily top 10 recipes data feature, food businesses can gain insights into which recipes and ingredients are performing well in different regions and segments of the market (we're planning to add subregions in the near future!)
Lastly, by keeping a close eye on the latest recipes and ingredients, food businesses can innovate and differentiate themselves from their competitors, which can help them to stand out in a crowded marketplace.
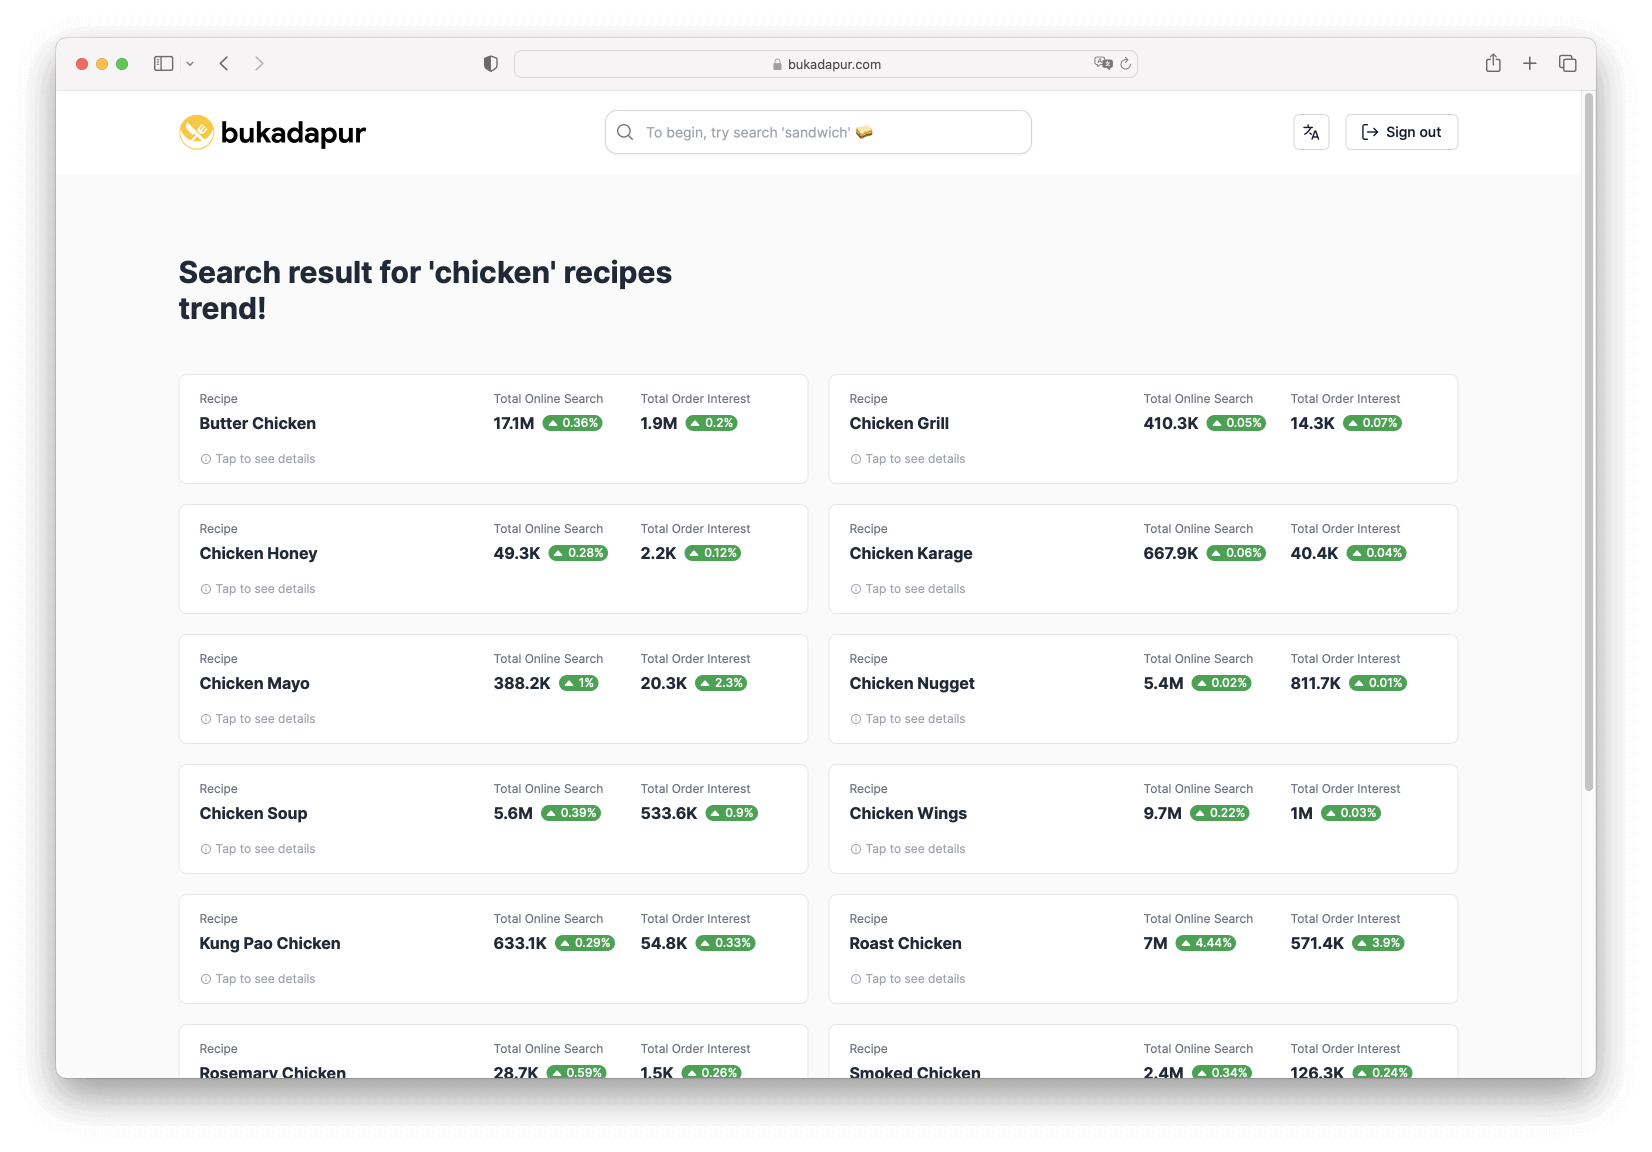 2. Similarity Search Experience
What if business owners don't know the name of certain dish?. Well, in Bukadapur, as an example, users can type chicken and our system provides similar results with other chicken related dishes (each are embedded with it's own updated data metrics) that users may never heard before!
The goal of this experience is to provide F&B business owners with blitz accessibility in exploring new and potential recipes at ease, which is relevant to this users' need statement: A platform that provides easy-to-use data collection tools that can be used by business owners with limited technical knowledge and resources
 3. Category Based Search Experience
Similar to Similarity Search Experience, the goal of this experience is that F&B business owners can easily search and find specific dishes or food categories they are interested in with easy navigation. This could save user's time and giving them more room to focus on making robust decision
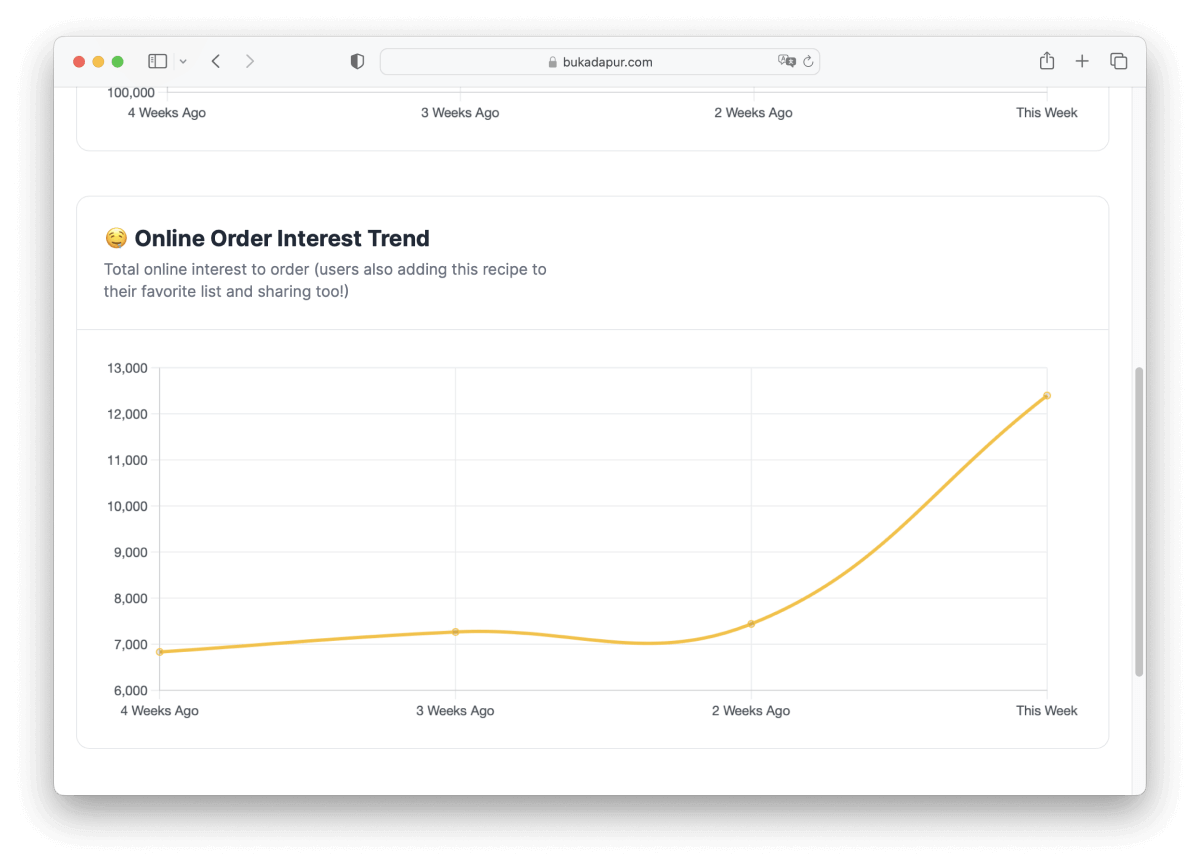 4. Trend History Timeline Experience
The goal of this experience is to provide F&B business owner with a clear visualization of how food trends have evolved over time, allowing business owners to identify patterns and forecast future trends. By tracking the rise and fall of certain food items, business owners can make data-driven decisions about what to add or remove from their menus, as well as how to market their offerings.
D. Learnings
First, in order to create a robust and accurate recipe trend analytics platform, it's important to ensure that the data being used is of high quality and reliable. This involves identifying reliable sources of data, cleaning and standardizing the data, and ensuring that the data is relevant.
Secondly, flexibility is important. Why? Food trends are constantly evolving, so it's important to design a recipe trend analytics platform that is flexible and adaptable to changing trends and user needs. This involves creating a platform that can handle large amounts of data, and that can be easily updated and modified over time.
Third, accessibility is also pivotal. How? in order to make sense of large amounts of data, it's important to create clear and intuitive data visualizations that users can easily understand. This involves using a variety of chart types and visualization techniques, and designing a user interface that is visually appealing and easy to navigate. That's why I came up with the keyword pairing search experience. Thank you for reading!